How to Navigate Google Analytics Like a Pro (Way Beyond the Basics)
It’s not often that we get this lucky.
One of the most powerful analytics tools is right at our fingertips.
I’m talking about Google Analytics.
It offers some of the most advanced tracking and reporting features that I’ve seen. And it’s completely free to use.
Shockingly, not many people take advantage of that.
This got me thinking.
Why don’t people make better use of Google Analytics?
Well, it’s likely for two reasons:
- They don’t quite understand how crucial data is to business success.
- Google Analytics isn’t the easiest tool in the world to navigate.
I’ll address both of these in this article.
I won’t dwell on the first one too much because I’ve noticed that people are developing a bigger appetite for data.
As for the challenges of navigating Google Analytics, I get it.
There are lots of features, and it can get overwhelming quickly.
Fortunately, I have a good handle on how this stuff works, and I’ll share my insights with you.
You don’t need to be tech-savvy to master Google Analytics.
In fact, you can start from ground zero and become pretty dang good at navigating all the features in just a few hours.
Our goal here is mastery without the complexity.
Sound good? Let’s get into it.
Why a data-driven approach to business matters
Successful businesses aren’t built on guesswork. They thrive on your ability to make data-driven decisions.
When you don’t have critical analytics in place, you’re taking the shotgun approach. You fire some pellets and hope that one hits the mark.
Wouldn’t you rather use a sure-fire approach?
Adding relevant data to your arsenal can make your efforts far more specific. And it’s especially important for marketing.
Here’s a map of what a sound marketing strategy looks like using analytics:
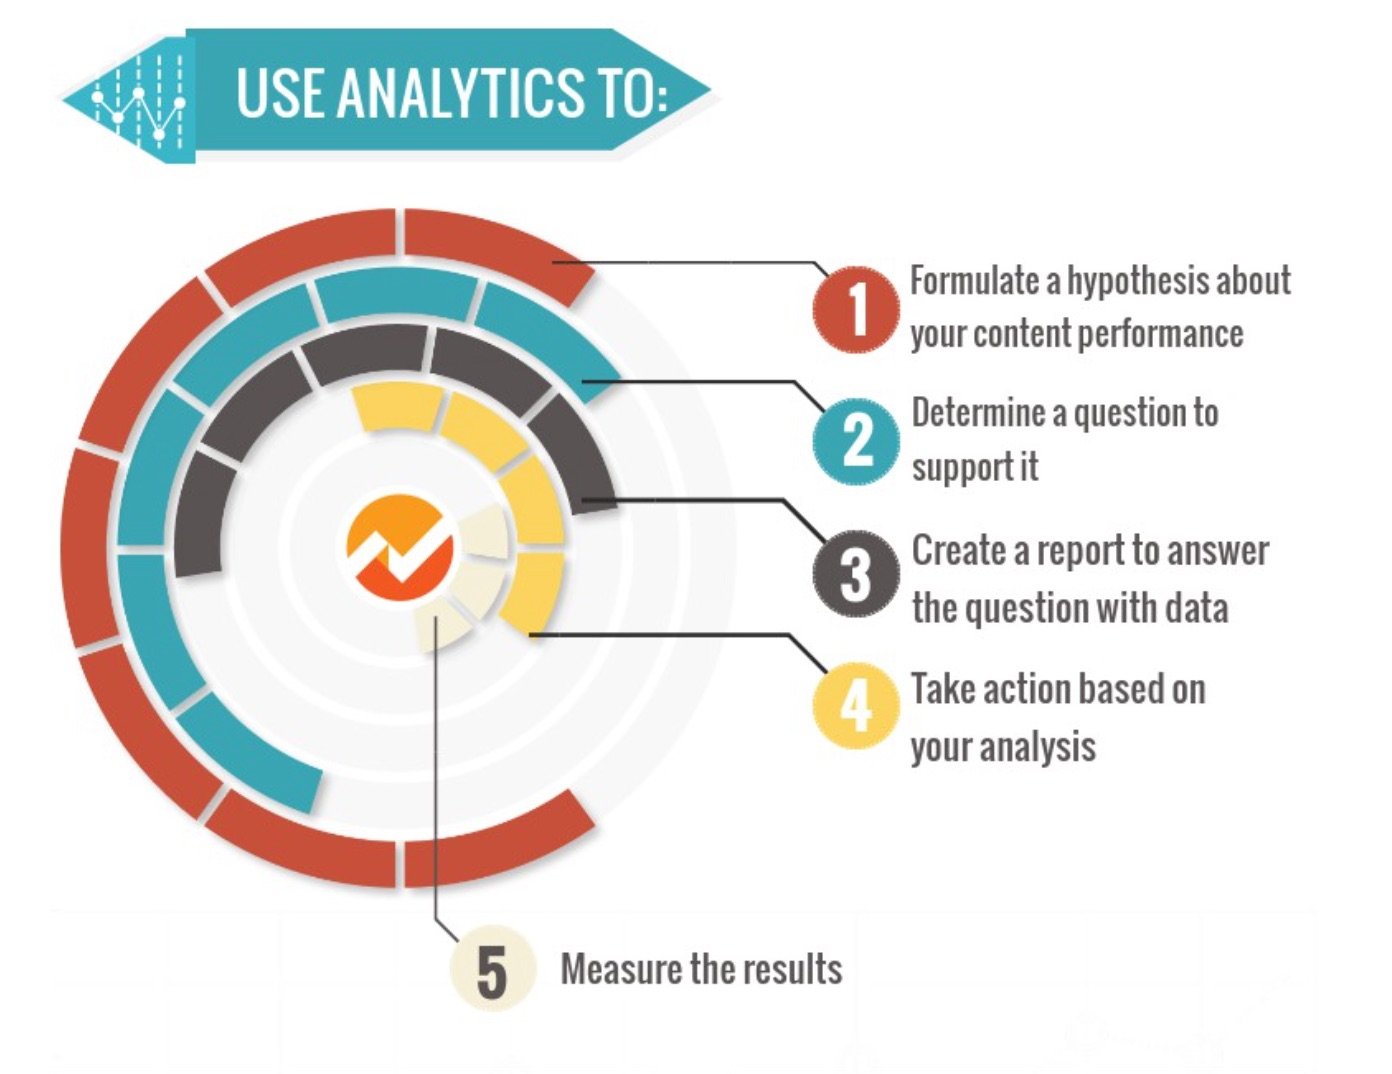
Do you see how this is a much better approach than acting blindly?
You get the ability to really see your customers.
You can analyze where they come from, how they interact with your business, and what makes them tick.
You can also understand how effective your marketing efforts are and what you can do to improve them.
That insight is indispensable.
Your ability to drive conversions and sales depends on it.
With that said, let’s move onto the meaty stuff.

Laying the groundwork for collecting actionable data
Data is useless if you can’t make your way through it with clarity.
It means you won’t be able to extract any insights that you can act on.
Actionable data is what makes the magic happen.
Now, Google Analytics puts a lot of information in your hands. You don’t have to use all of it.
That’s why it’s important to begin with the end in mind.

So, what is your goal here?
What do you want to achieve in your business for the next 90 days? How about the next year?
Here are some ideas that may apply to your business:
- Increase engagement
- Drive more leads
- Improve conversions
- Increase revenue from e-commerce store
These are a few options. It’s not unlikely that you’ll have multiple goals at a given time.
You decide. Then, go to your Google Analytics account to configure your Goals settings.
I’m assuming that you already have an account set up with your tracking code fired up.
If not, here’s how to do it.
Once you’ve done that, you can find the Goals settings by clicking on “Admin” at the bottom of the menu.
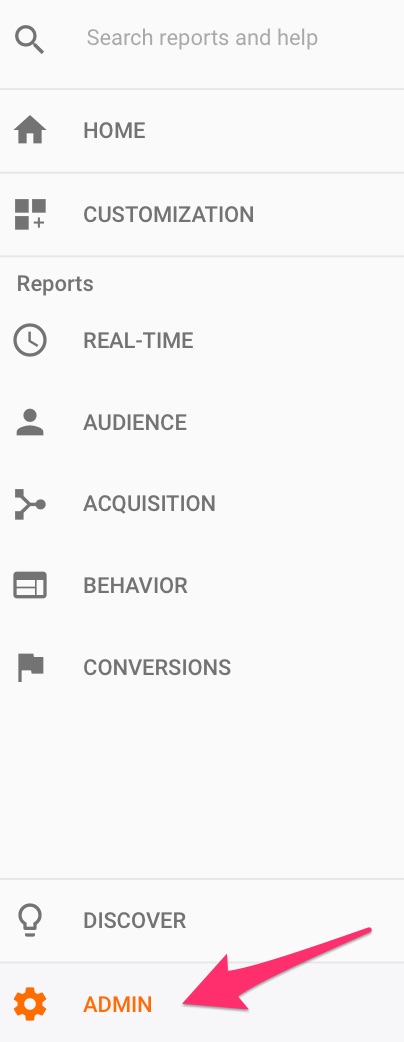
Here’s what you’ll see.
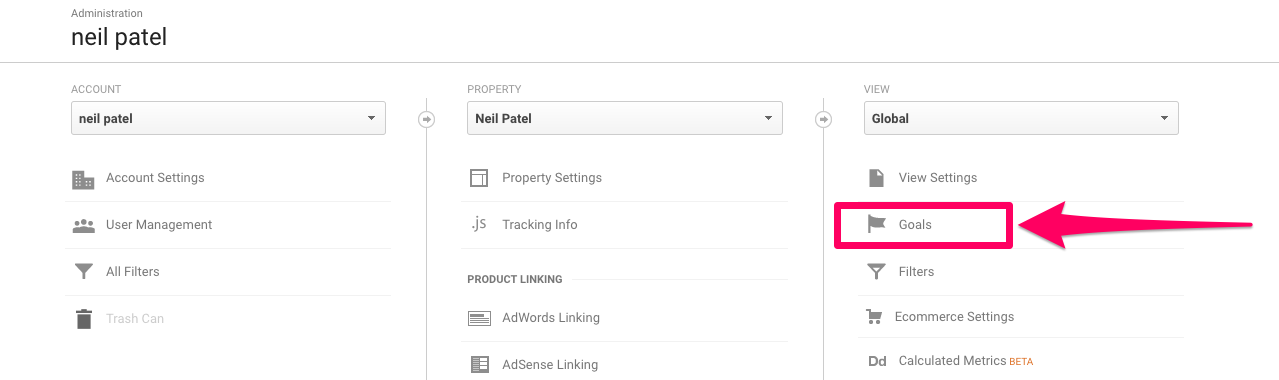
Click on Goals.
Why is this step necessary?
When you add a new goal, you tell Google Analytics exactly what to track. This way, you can stay on top of what’s happening on your website.
Let’s say that your objective is to increase sales conversions.
How would you know when a sale has occurred on your website?
One way to know is to check the number of visitors that have landed on your “thank you for buying” page.
You can set this up as a goal to be tracked on your Google Analytics account.
Here’s how.
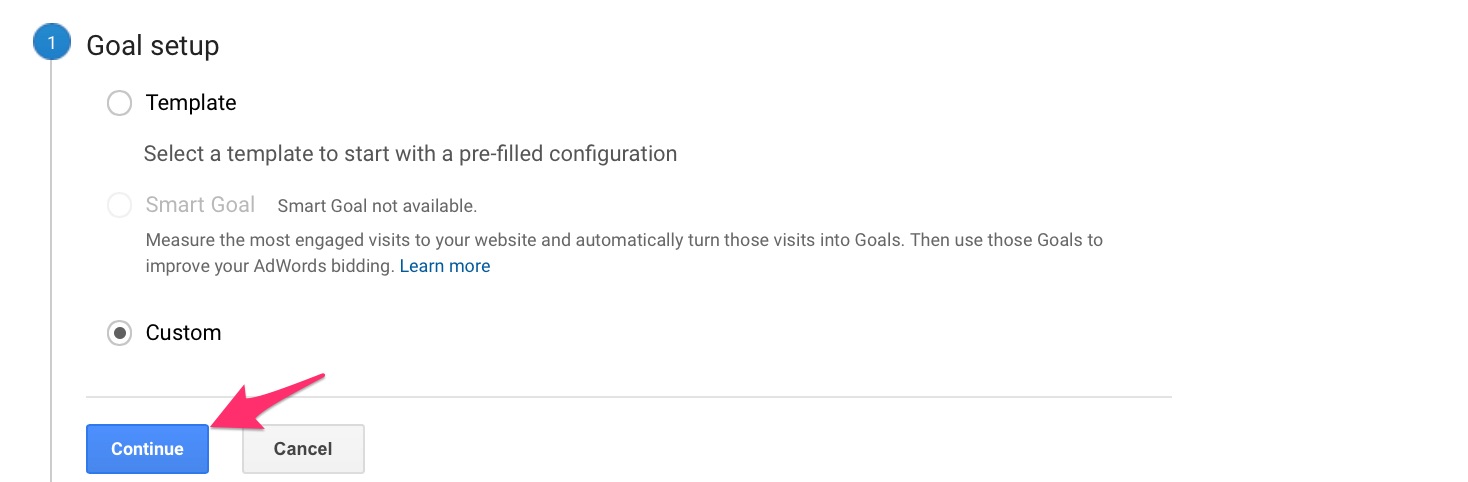
When you click on “Goals,” you’ll see a “New Goal” button.
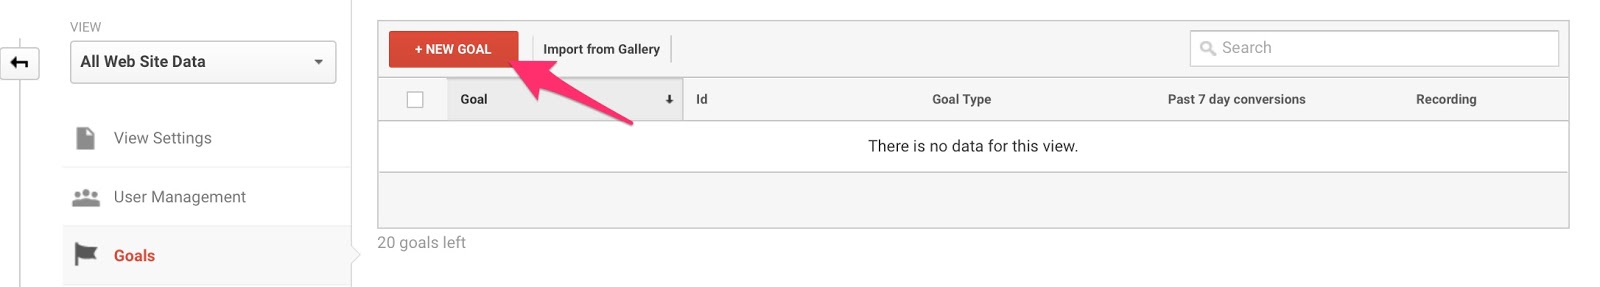
Choose “Custom” and “Continue.”
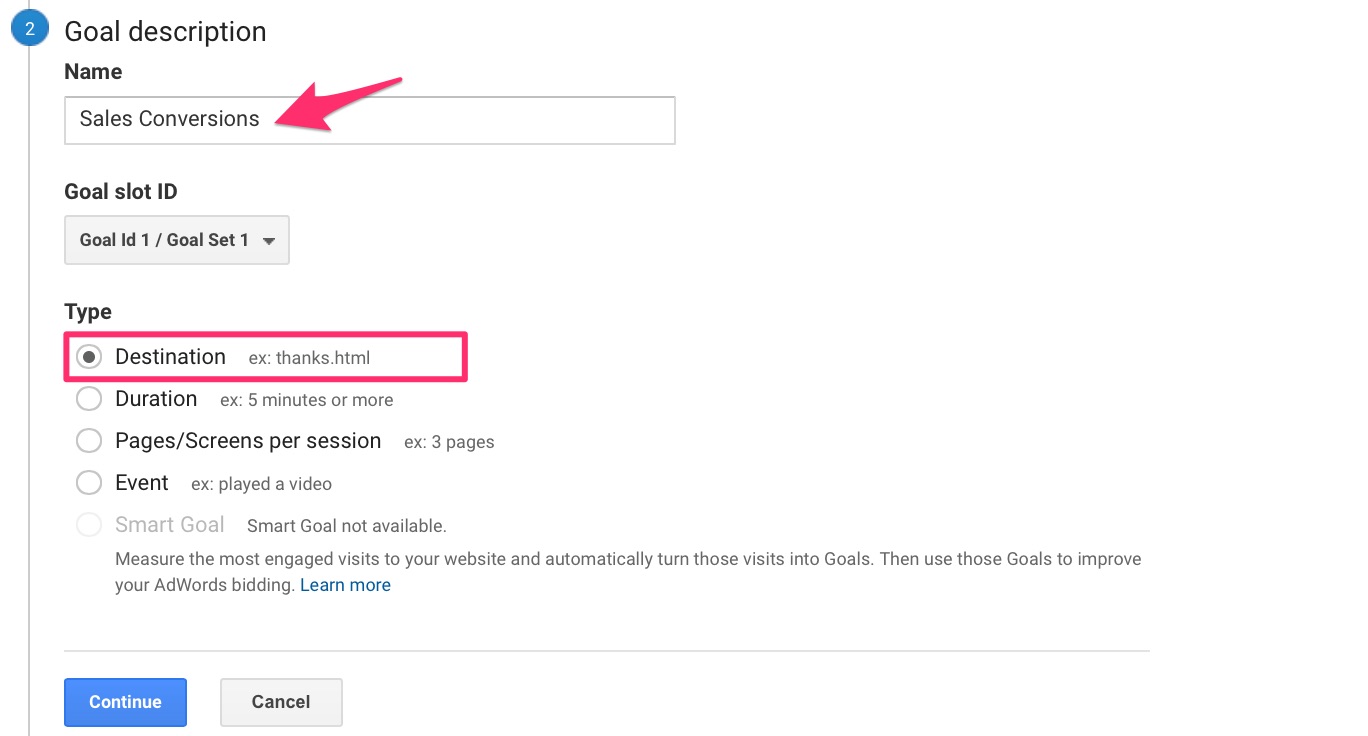
Name your goal, select “Destination,” and “Continue.”
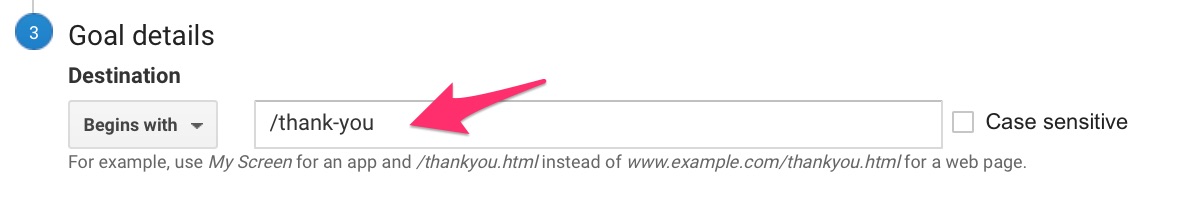
Configure your goal details by adding the URL of your “thank you” page as the “Destination.”
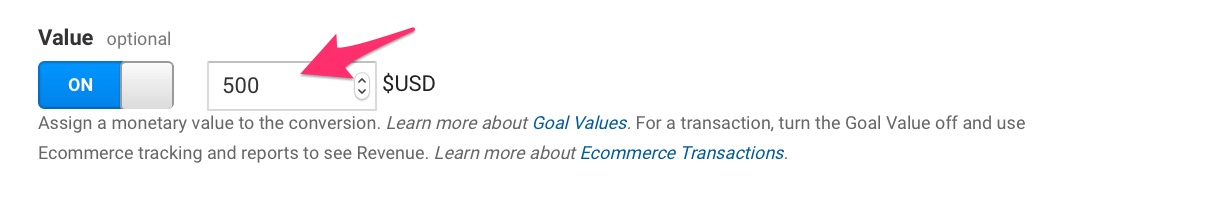
You have the option to add a monetary value to a conversion. What’s it worth to you?
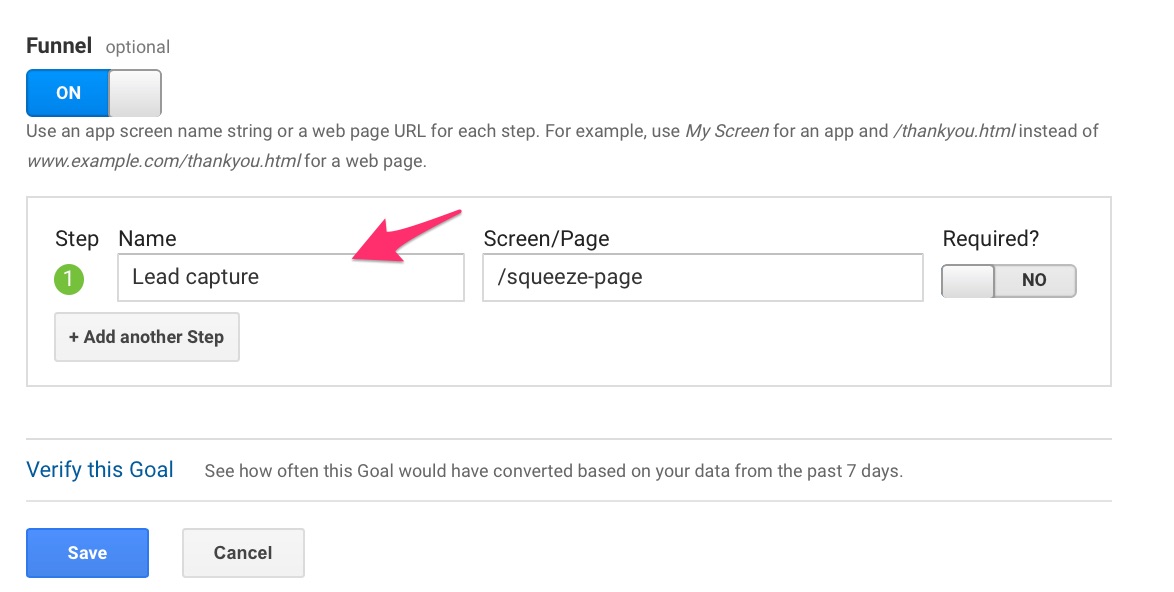
You also have the option to specify the path that someone would take leading up to a conversion.
Add all the steps and a corresponding web page for each one. Then save your goal.
You can repeat this process for up to 20 goals on your website.
Not too difficult, right?
Now that you have set some goals, it’s time to get into how to navigate Google Analytics reports.
I’m going to cover all the possible options for tracking and analyzing data. It’s up to you to extract the information that serves your goals.
Fair enough?
Good, let’s do this.
A deep dive into Google Analytics reports
There are several reports available to you.
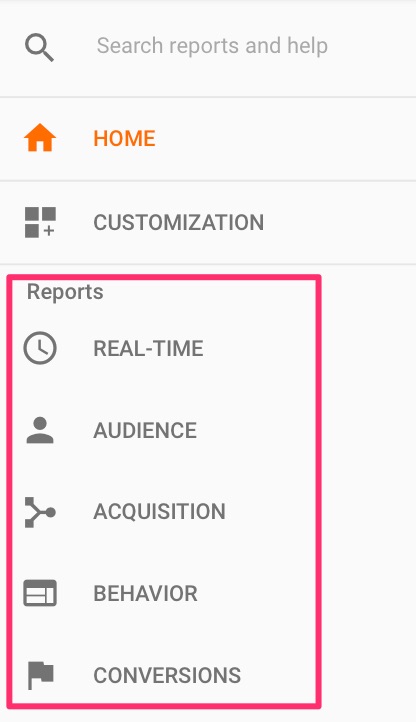
If you look at your left-side menu on your Analytics dashboard, you’ll see the five categories.
- Real time: The activity on your site in real time
- Audience: Inside scoop on your website visitors
- Acquisition: Details on how visitors found your website
- Behavior: What people are doing on your site
- Conversions: How behavior leads to conversions and sales
Regardless of your business goals, these reports are insightful.
I’ll get into the details of each one.
Real-time reports
As the name suggests, this type of report monitors what’s happening on your website right now.
You can see who’s visiting your site in a given moment, what website pages they’re engaging with, and how they’re influencing your goal conversions.
The “Real-Time” tab is spliced up six ways.
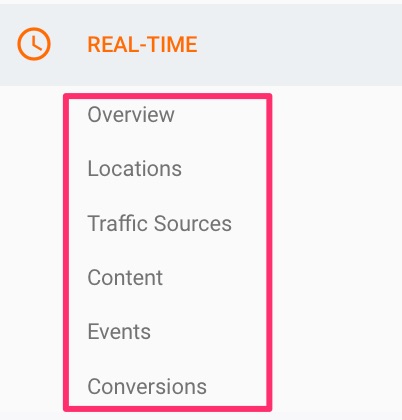
First, get an overview to see the big picture.
Then, you can delve deeper into the details.
- Locations: This tells you where your active visitors are from.
- Traffic sources: Home in on the sources of your website traffic.
- Content: Find out which pages your visitors are on and how many active users are on each page.
- Events: You can create custom events like a lead-magnet download and track that in real time.
- Conversions: Remember the goals that you set in the beginning? This tells you how these goals are being fulfilled.
You may be wondering, “What use is it to monitor website activity in the very moment that it occurs?”
That’s a good question.
Historical data is much more useful for making your decisions.
But there is utility in real-time reports.
It’s excellent for tracking marketing campaigns that have a sense of immediacy.
I’m talking about social media promotions, email marketing campaigns, traffic to fresh blog posts, and other urgent matters.

Well, with Google Analytics, that’s easy.
You can track the response as it happens. And that goes for all marketing activity that requires a look at the immediate impact.
Real-time reports are also great for split testing different elements on your website.
For example, you may want to test the creative elements of a particular ad to see which converts best.
You can set up an event for ad clicks and view that data. The ad that is triggered the most in any given moment tells you what you need to know.
That’s super useful.
Events can be created by configuring your goals settings. We already walked through how you can set that up.
Audience reports
Want an in-depth look at who’s visiting your website?
You may want to pay special attention to this feature.
The reports under this section will give you information on your visitors from multiple angles.
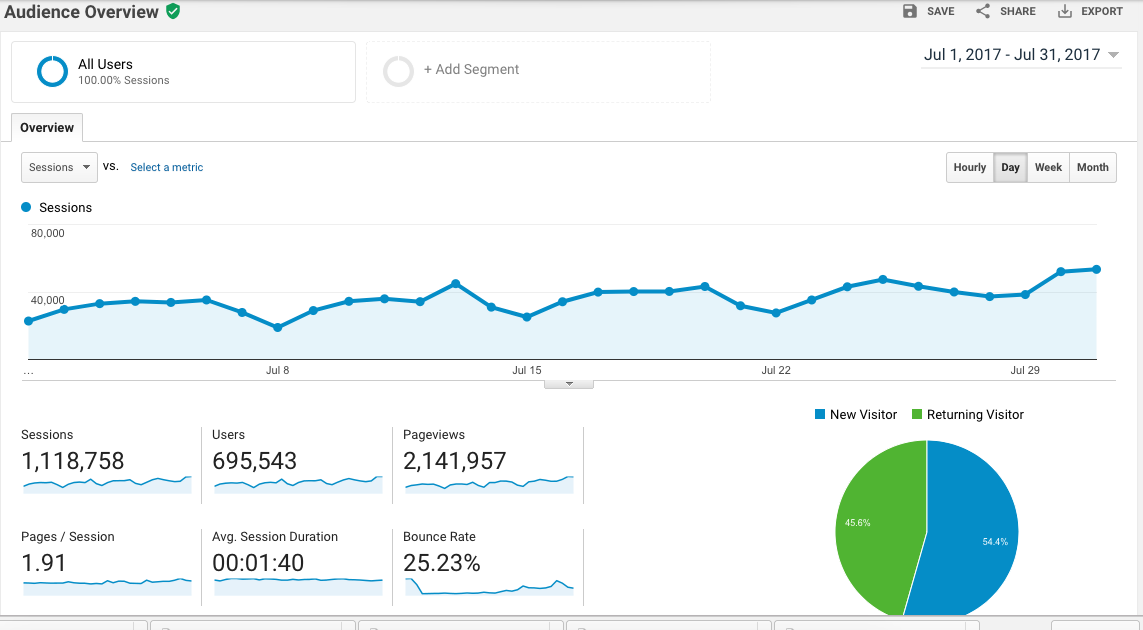
I recommend getting an overview first to analyze some important metrics.
- Sessions
- Users
- Page views
- Pages per session
- Average session duration
- Bounce rate
- New sessions
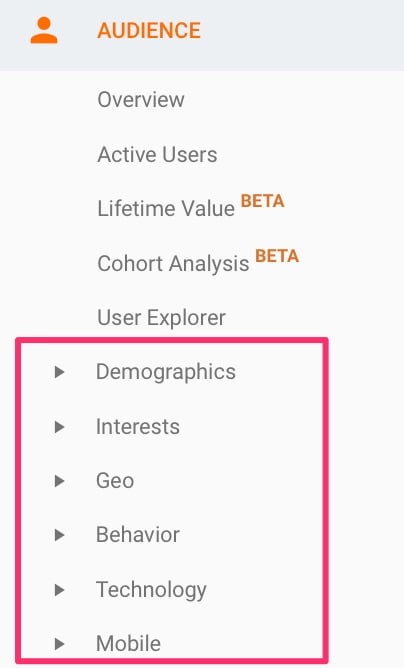
Then you can dive into the subsections for more detailed insights.
Let’s explore some of the information that you’ll find in these sections.
- Demographics give you the age and gender of your audience.
- Interests highlight what your audience is interested in and how that may match up to commercial intent.
- Geo gives the location and language of your web visitors.
- Behavior tells you how users interact with your website. You’ll get information like new versus returning visitors and engagement as well as frequency and recency of visits.
- Technology tells you which browser, operating system, and network that visitors use.
- Mobile gives you the number of mobile, tablet, and desktop users. You can also track key metrics for each device.
- Benchmarking allows you to compare your data with others in your industry who wish to share their data.
- Users flow-maps the path visitors take through your website.
As you can imagine, this data can power your marketing efforts across multiple channels.
Think about it. There’s no information as insightful as what you collect on the people who matter most.
Everything from your content to your ads will be more effective because of audience reports.
Acquisition reports
Let’s talk about traffic.
Without it, nothing else can move forward.
No engagement. No leads. No conversions.

This way, you can tap into the traffic sources that are working best for you so you can maximize that.
And it’s not just about which channel brings in the most visitors. It’s also about which one drives the highest-quality traffic.
What determines quality?
Well, you don’t want to attract spectators. Instead, you want the type of visitors who engage with your content and eventually makes a purchase.
Your acquisition reports will help you with all these insights.
I want to reiterate this:
Collecting data without acting on it is a waste of time and resources.
Let’s say that you find out that LinkedIn brings you the most qualified leads. It’s up to you to double down on that social channel to drive more leads and ultimately conversions.
Sound good?
Here are the different subsections available to you under “Acquisition.”
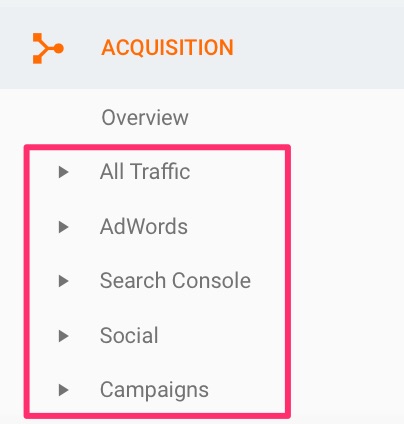
For organic traffic, I recommend that you pay particular attention to “Overview,” “All traffic,” “Search console,” and “Social.”
“Campaigns” and “Adwords” are geared toward paid traffic.
Behavior reports
Just as important as traffic is how your web visitors interact with your content.
Behavior reports will give you the kind of information that’s necessary for optimizing the user experience on your website.
It will also give you an engagement breakdown on each page.
From there, you can decide which elements on your website perform best, which need improvement, and how you can bridge the gap.
Here’s a breakdown of what you’ll find.
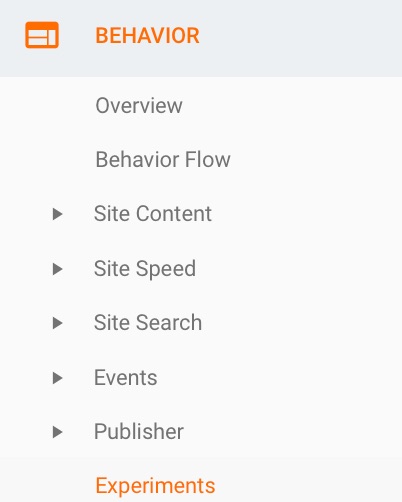
Let’s look at the most important ones.
- Behavior flow explores the path that visitors take on your website.
- Site content gives you the top-performing content. This is excellent for coming up with a high-impact content strategy by capitalizing on what already works for you.
- Site speed pinpoints any factors that may slow down your site and gives suggestions to improve it.
- Site search provides information about users who use your search bar.
- Events tell you the specific actions that users take on your website.
- Experiments allow you to test website pages to see which fulfills your conversion goals the best.
The site-search feature has to be configured first.
It’s super important, so I highly recommend you do that. It’s tied to the search box on your website.
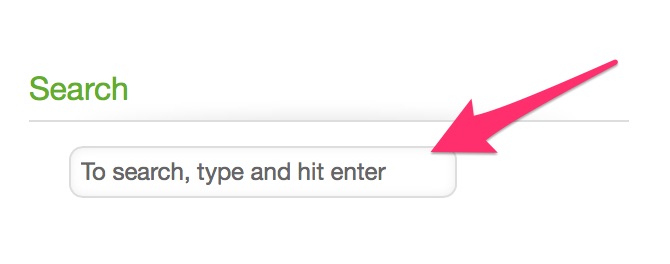
Here’s how.
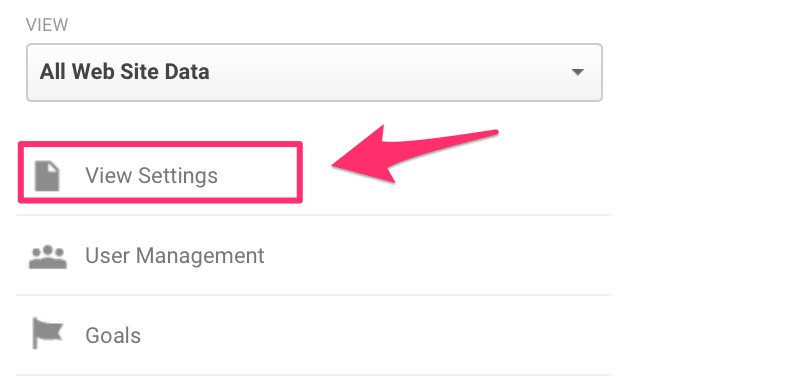
Go to “Admin” on your account and click “View Settings.”
At the very bottom, find the “Site Search Settings.”
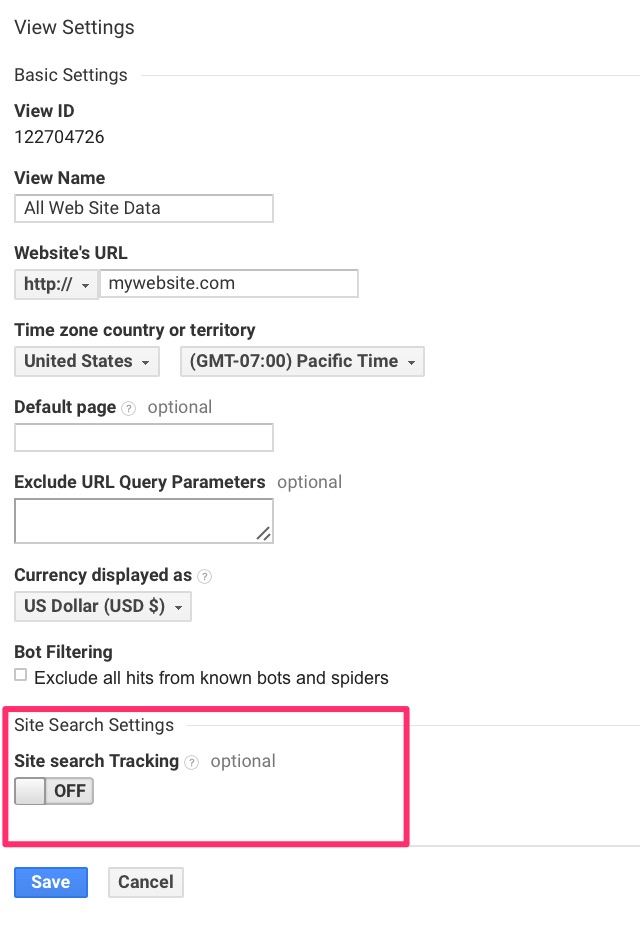
Toggle the button to on and leave the window open. You now have to find the “query parameter.”
To do that, go to your site and run a random search.

Note the URL of the results page for that search.
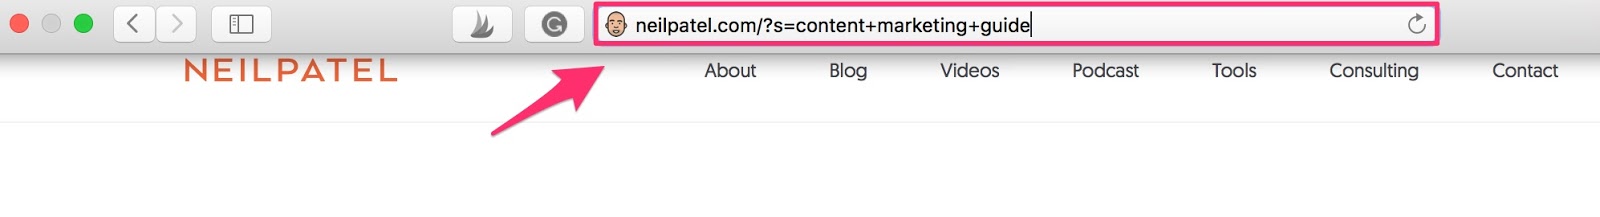
The query parameter is the letter that comes at the end of the URL following the question mark.

In my case, it’s an s. It’s usually an s or a q.
Go to Google Analytics and type that in.
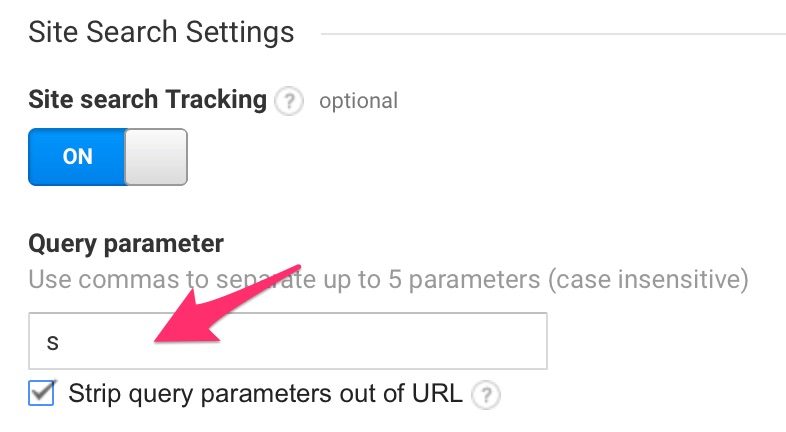
You can also enable site search for different categories. This is excellent for tracking the most popular content categories.
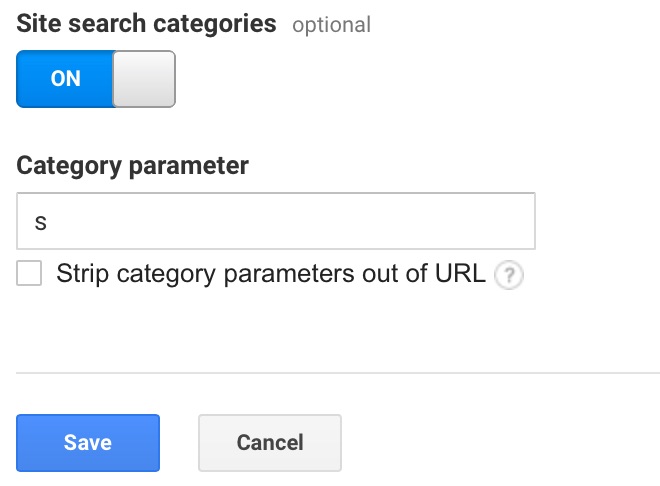
And that’s it! You’ve configured site search.
Conversions reports
Who doesn’t love conversions?
This is where the magic happens.
You’ll find data relating to the actions that visitors take when they’re on your website. This could be anything from a newsletter sign-up to a product purchase.
Let’s look at the information you’ll get under conversions.
Want a breakdown?
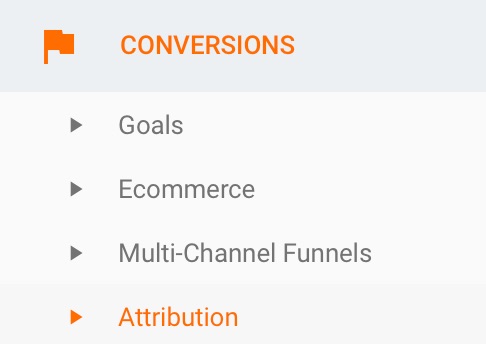
- Goals help you keep track of the conversions goals that you set in in the beginning.
- E-commerce gives you information on your e-commerce store. Data includes product information, average order value, time of purchase, and more.
- Multi-channel funnels give insight into how marketing channels work to create conversions.
- Attribution lets you attribute conversions to a specific customer touchpoint.
Naturally, this layer of reporting may not be useful to businesses that are not yet generating sales.
But if you’re at that stage, this information is golden.
You can determine which products sell more and what part your marketing efforts have to play in these sales.
You can also get the details of each transaction to see how you can maximize your profits and increase your customer value.
These are all key growth needles in business that you should be focused on.
Beyond basic reporting: Advanced Google Analytics features that you should know
We’ve gone through every aspect of reporting on Google Analytics.
Here’s the thing though:
Standard reports don’t even begin to touch the full capabilities of this tool.
Sure, you’ll get some awesome data that can transform your sales and marketing.
But I want to delve into the realm of advanced segments, tags, filters, custom dashboards, and all that fun stuff.
Don’t get put off by some of the terms.
This is easy, and I’ll simplify it even more for you.
Let’s start.
1. Create advanced segments
Remember what I said about actionable data?
You need to be able to use the information that you collect.
The overarching reports on your website visitors don’t give you the most actionable intel.
It’s undifferentiated and surface-level information.
That’s where advanced segments offer a unique opportunity.
You can isolate traffic and view data from a specific viewpoint.
For instance, you can segment by:
- Device
- Engagement level
- Traffic source
- Location
- Landing page
- Content viewed
- Demographics
These are just a few options.
Here’s how to create segments.
Go to “Audience” and then “Overview.” Click on the option that says “Add Segment.”
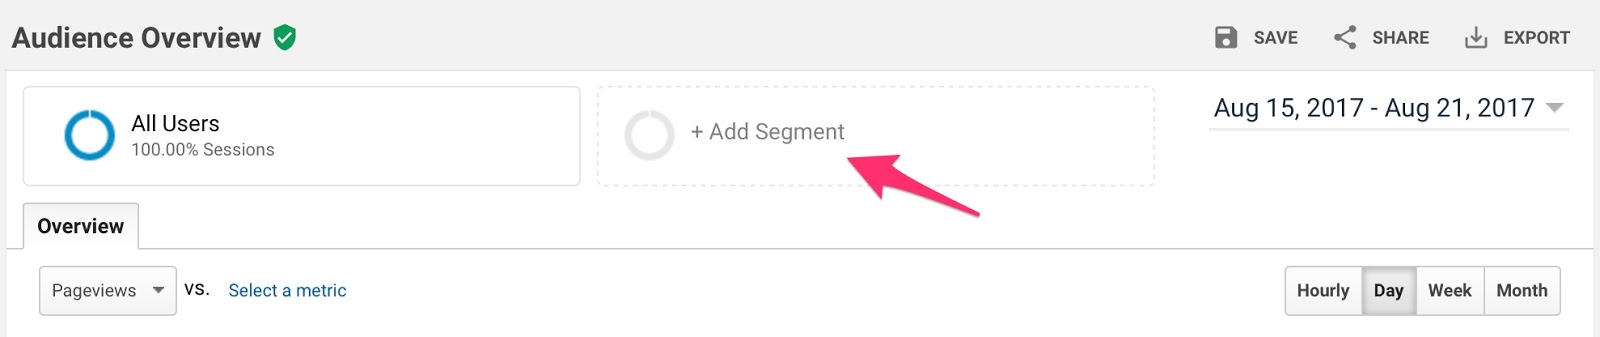
You’ll be given a list of segmentation options to choose from.
Check the ones that you want and click “Apply.”
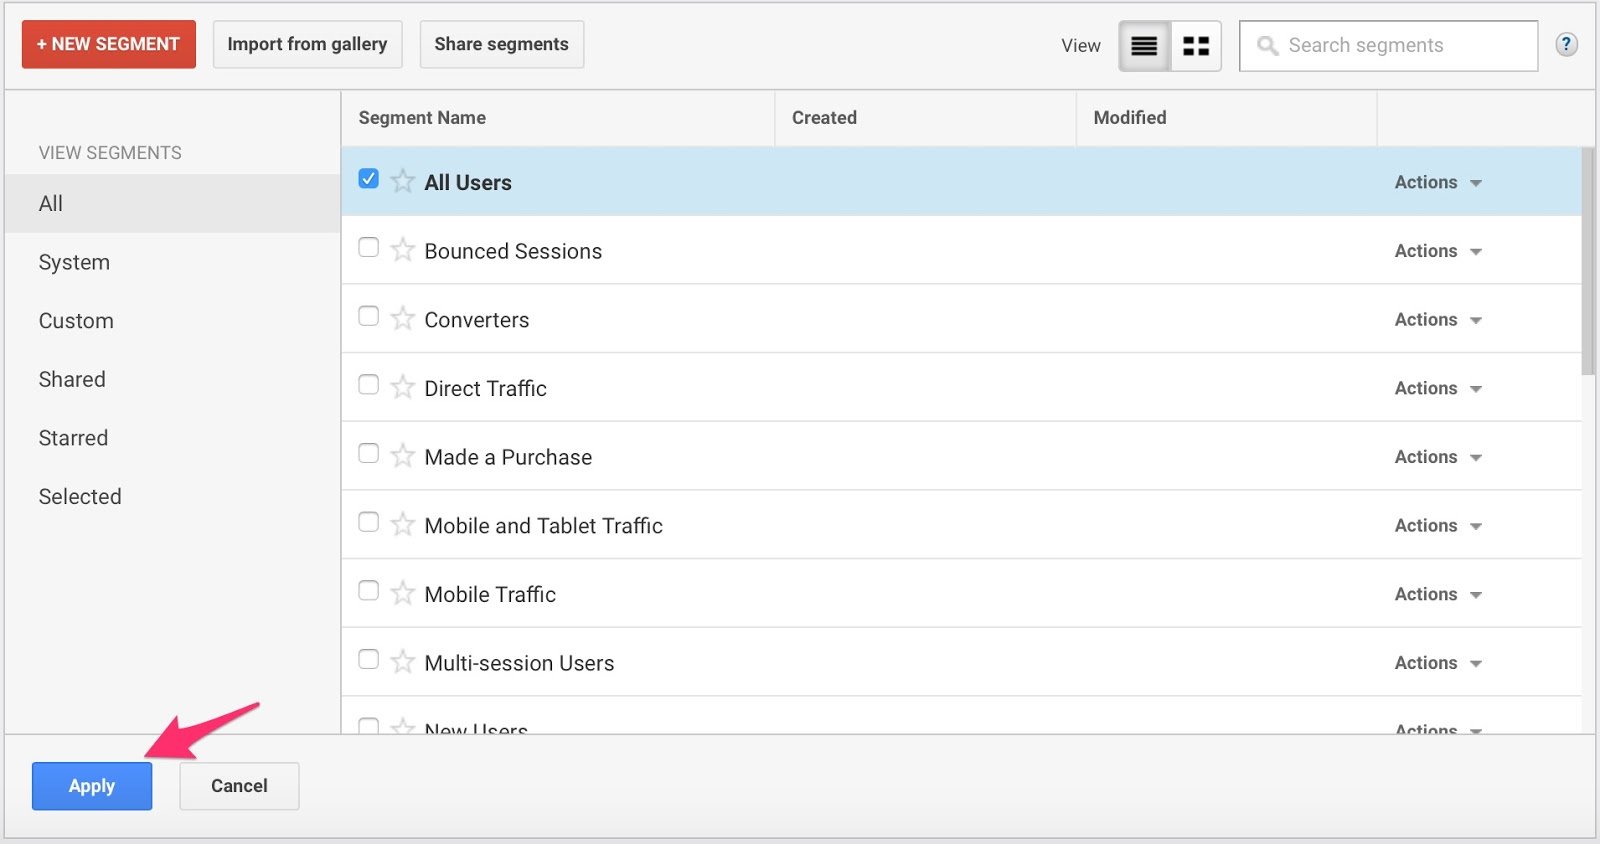
Are you restricted to the default options? Not at all.
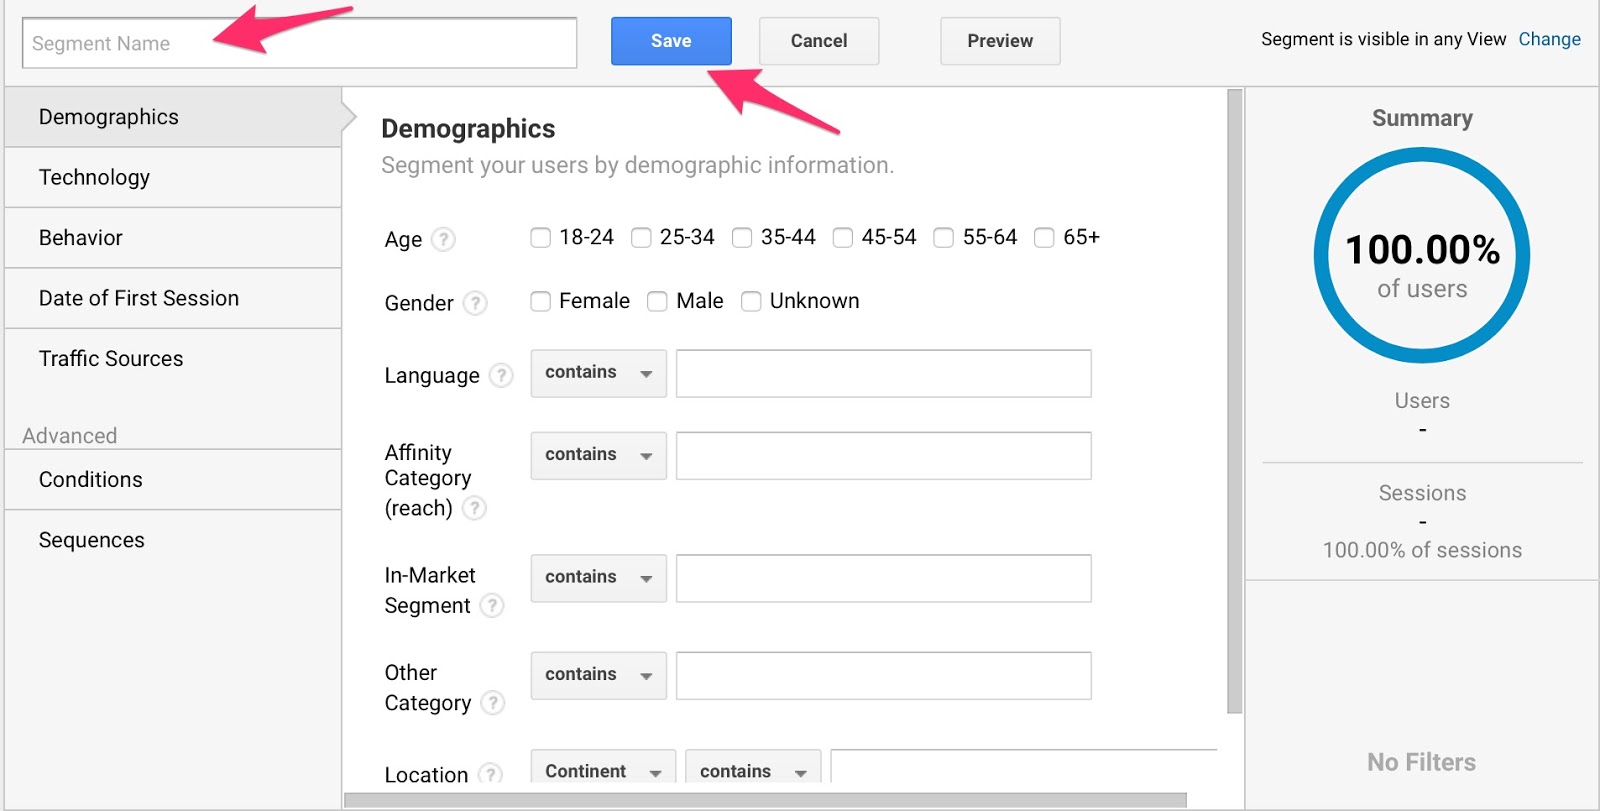
You can create your own. Click the button that says “+New Segment.”
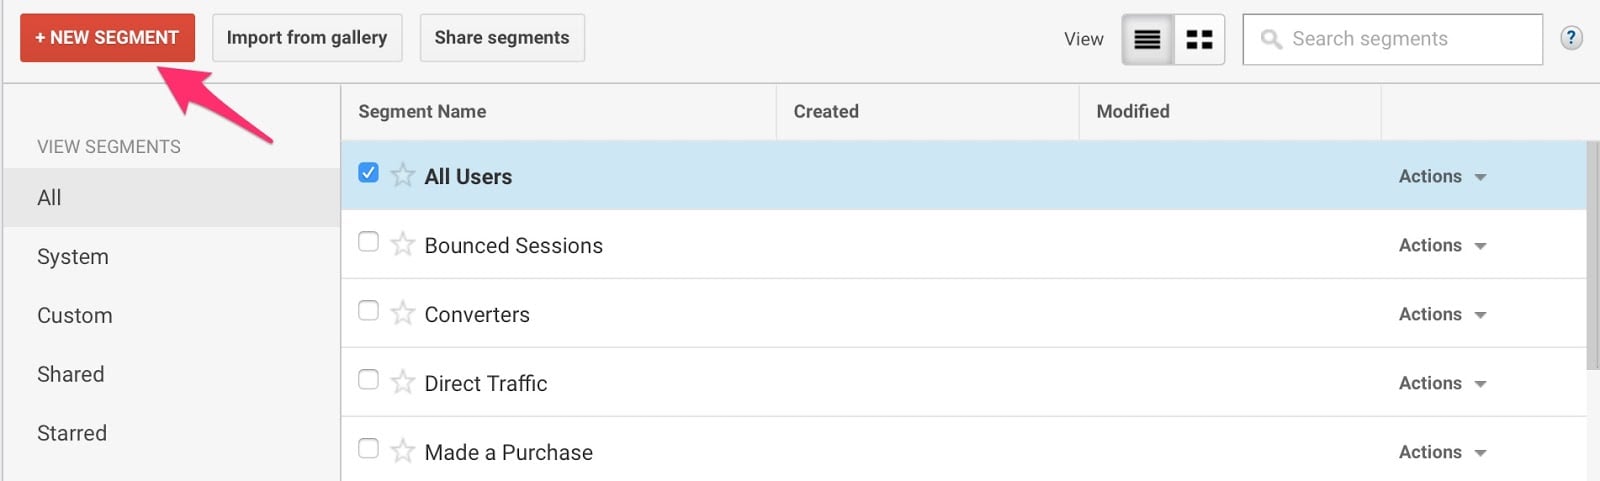
You can toggle the options here to define your custom segment. Include as much information as you like, name your segment, and save it.
Your data will automatically be updated to feature all the segments that you create.
2. Customize your Google Analytics dashboard
The default dashboard is not very useful.
Why?
It doesn’t tell a cohesive story about what’s happening on your website.
You’ll get a range of data that may or may not be related to each other.
With custom dashboards, you can pull specific types of data together. It tells a better story visually and will have more meaning to your business.
You can create custom dashboards for any number of purposes.
- Social-media monitoring
- Brand monitoring
- E-commerce activity
- SEO
- Tech
And much more!
You can create up to 20 dashboards, each with 20 widgets.
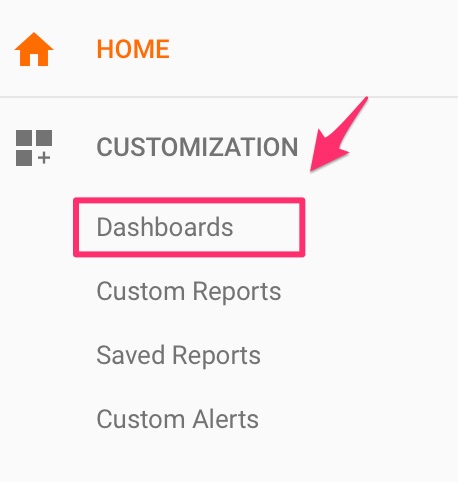
Here’s how.
Find the customization tab and click “Dashboards.”
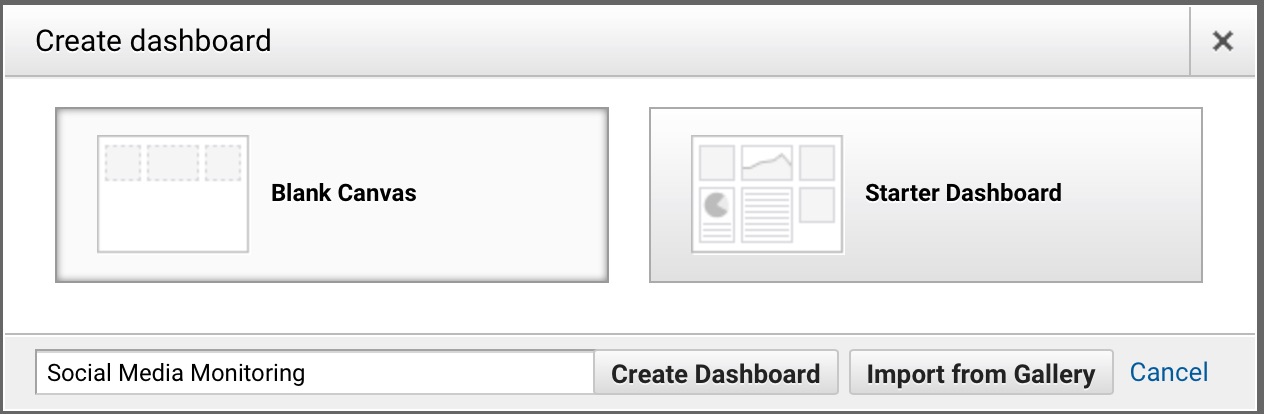
Click “create.”
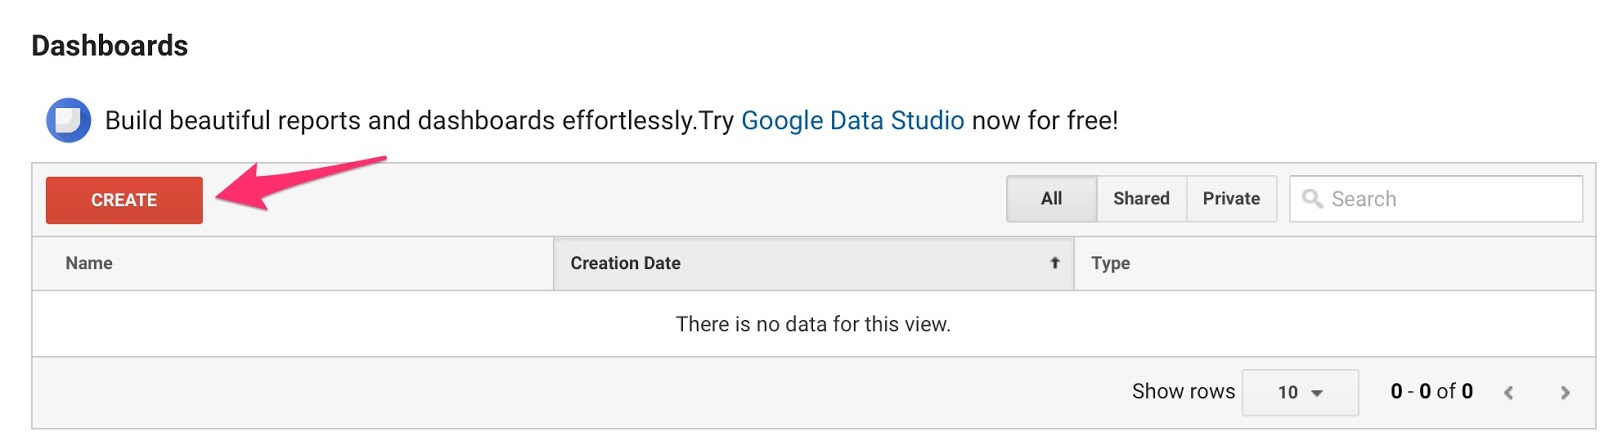
You can opt for either a “blank canvas” or “starter dashboard.” There’s also an option at the bottom to “import from gallery.”
Which should you choose?
You decide.
The “blank canvas” allows you to put your dashboard together from scratch. “Starter dashboard” gives you templates to work from.
You can also use a custom dashboard created by someone else. Simply import it from your gallery.
Choose your option, name it, and click “Create dashboard.”
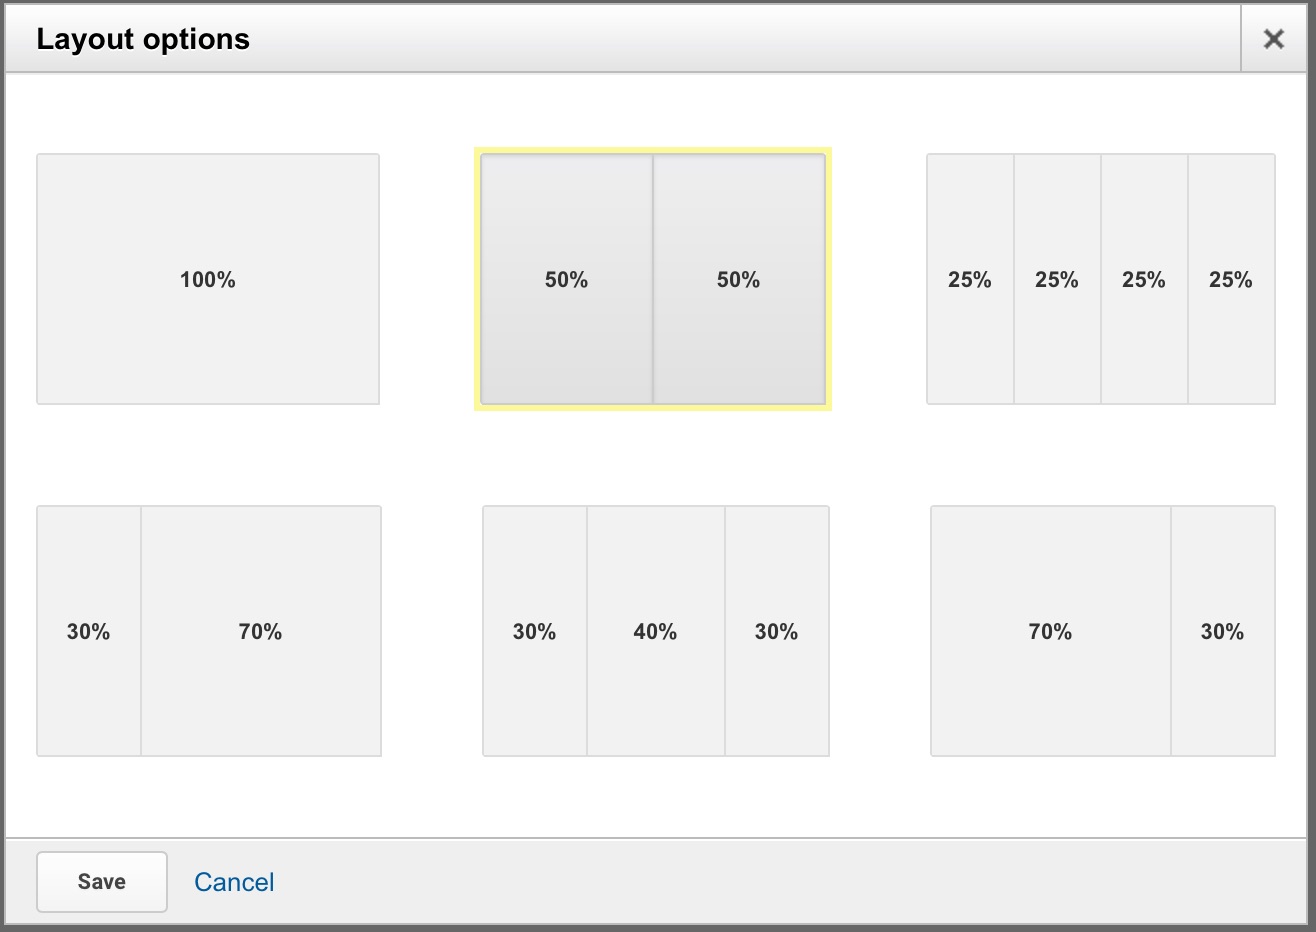
Click on “customize dashboard” to select a custom layout.
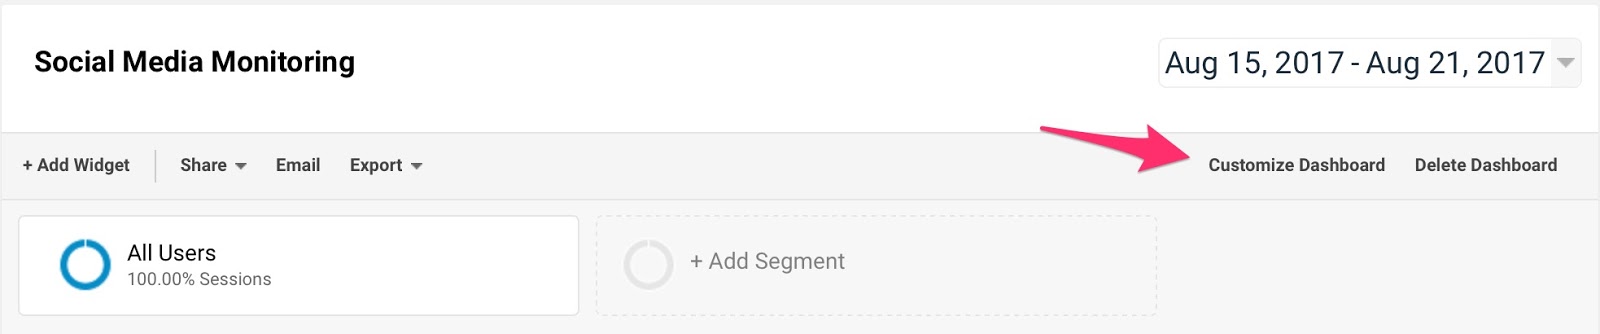
Decide based on whatever screen real estate you’re working with or the number of widgets you’d like to include.
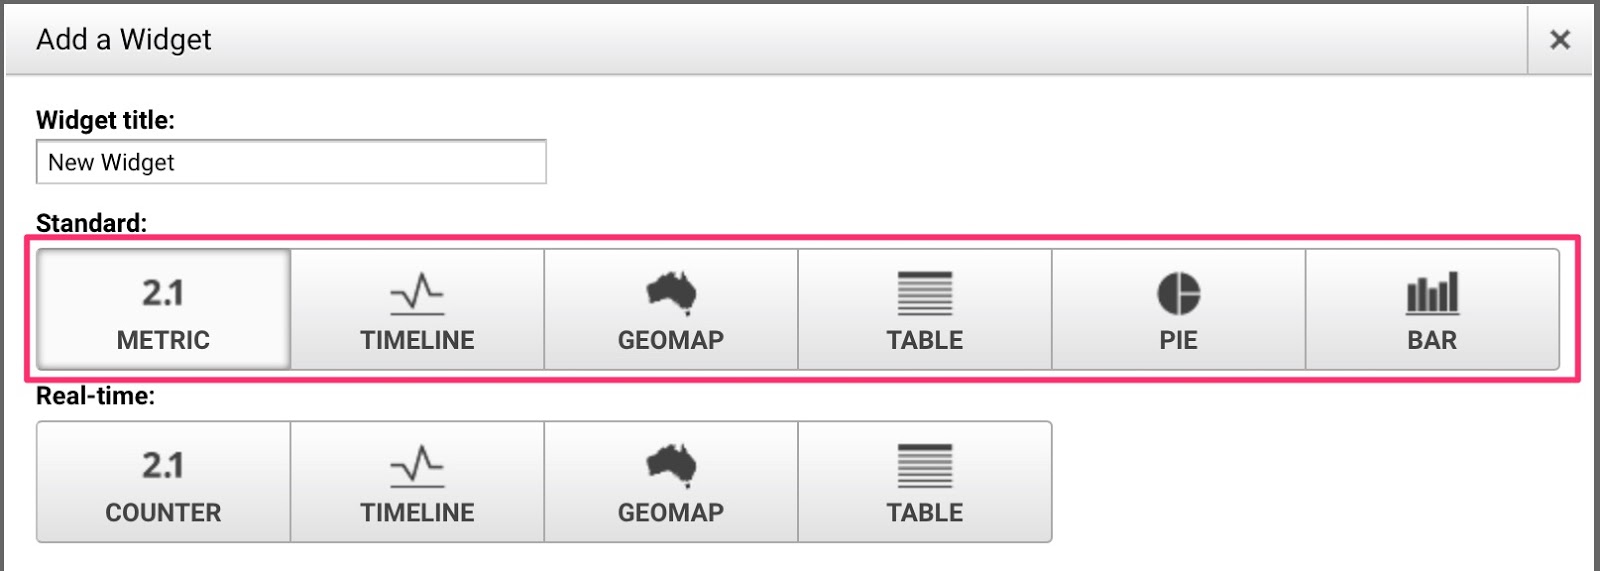
Then, go to “+Add widget” to fill out your custom dashboard.
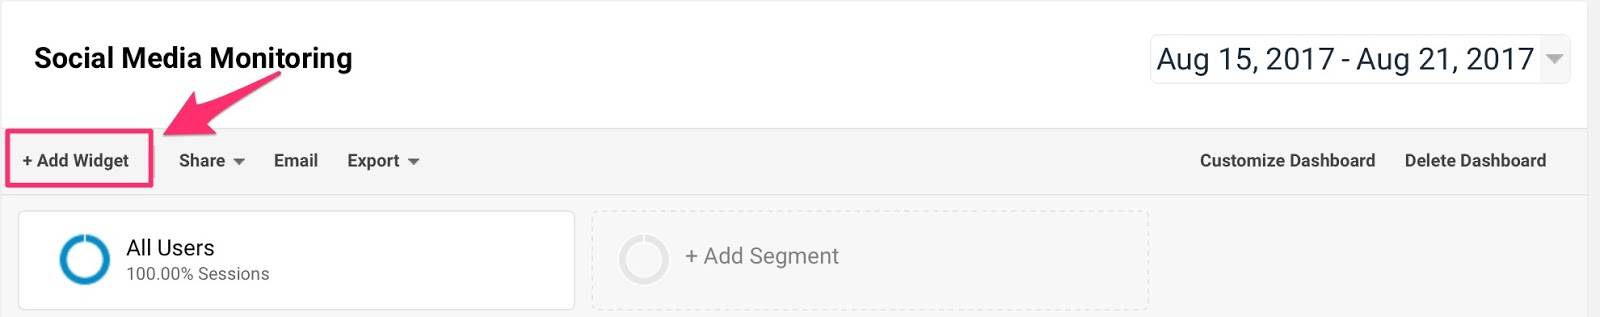
Give your widget a title and select one of six options for the type of widget you’d like to add.
This is simply to decide how your data will be displayed.
Standard widgets give you historical data, while real-time widgets give you data as the actions happen.
Now, click “add a metric.”
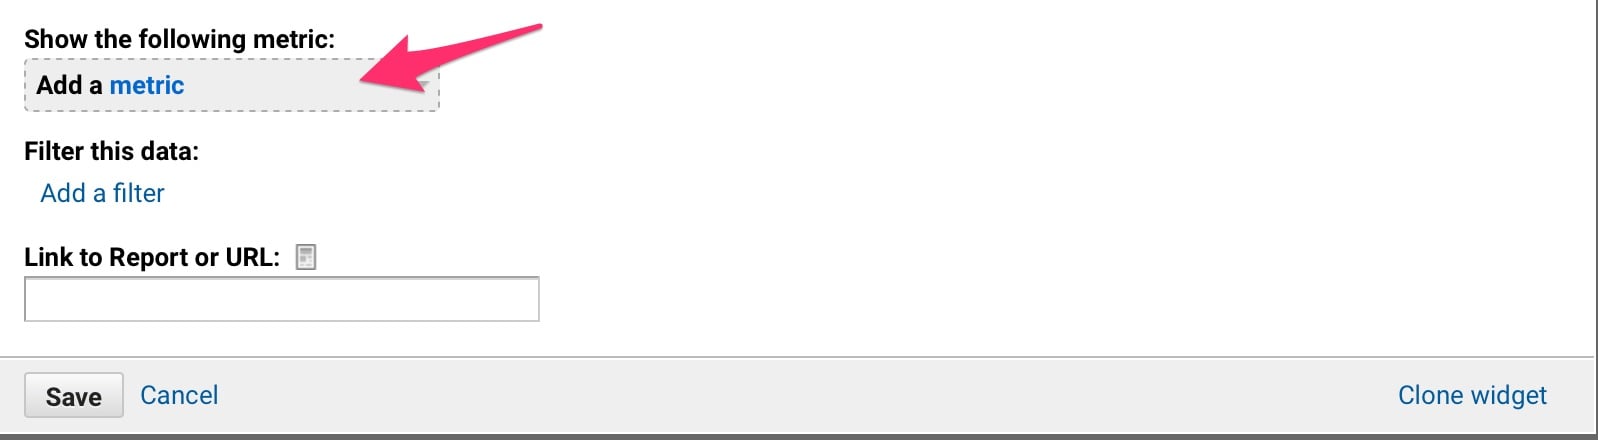
You’ll get a menu with a ton of options.
Select the ones specific to the custom dashboard that you want to create.
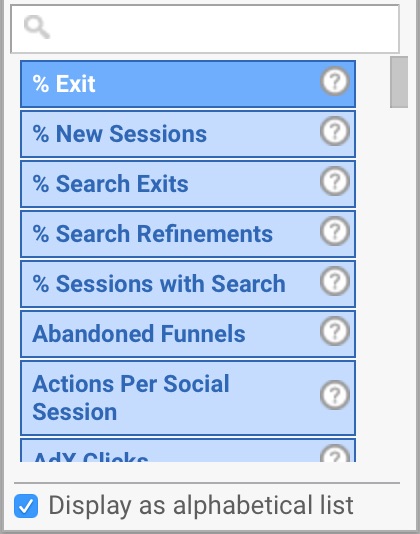
Let’s say that you want to build a social media monitoring dashboard. You may want to include metrics like:
- Traffic by social source
- Social visitors by device type
- Actions taken by social visitors
- Social shares on content
These are just a few options.
Once you’ve configured your custom dashboard, save it, and your data will be available.
3. Create custom reports
As we saw earlier, you have five types of reports available to you.
Each of these has about 5-10 subsections.
That’s a lot of data!
The point of custom reports is to home in on the information that is relevant to your business.
You can create reports based on:
- Mobile performance
- Daily e-commerce traffic
- Referring sites
- Metrics by day of week
- Keyword analysis
Useful, right? Here’s how you can do it.
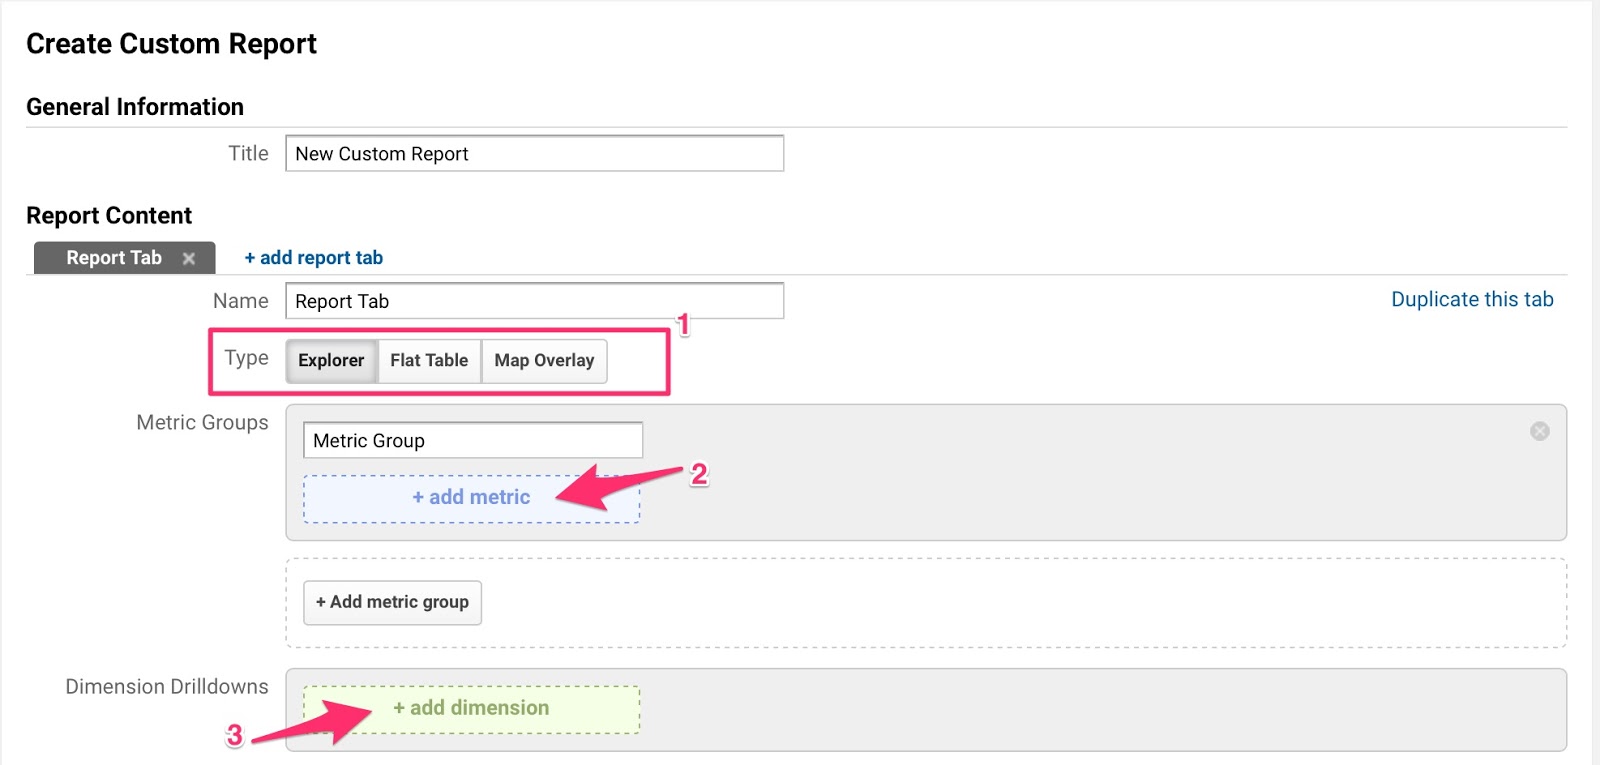
Go to “Custom Reports” and click “+New Custom Report.”
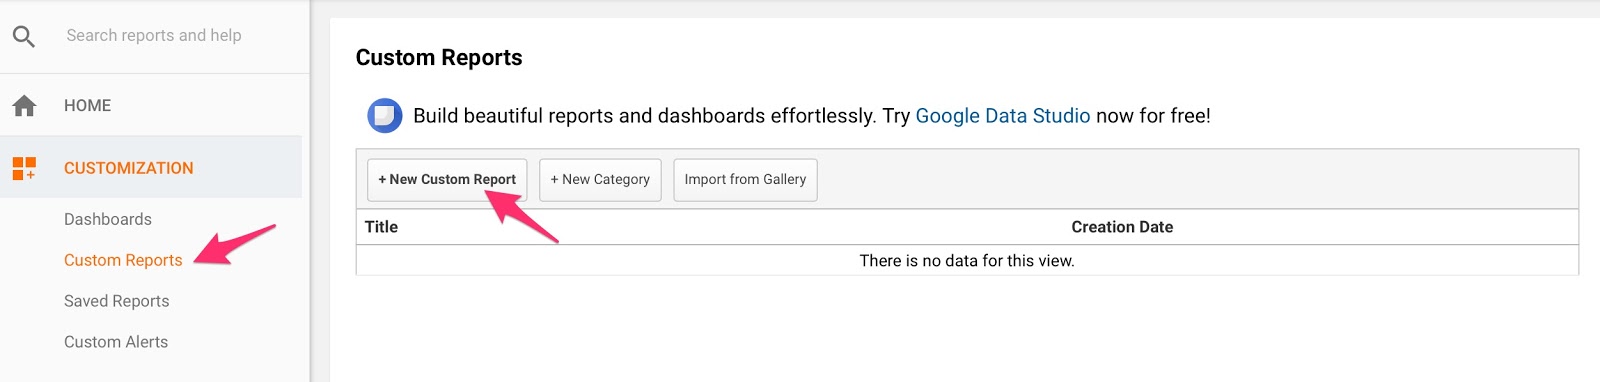
Select your report type, metrics, and dimensions. Explore the options to see what’s best for your needs.
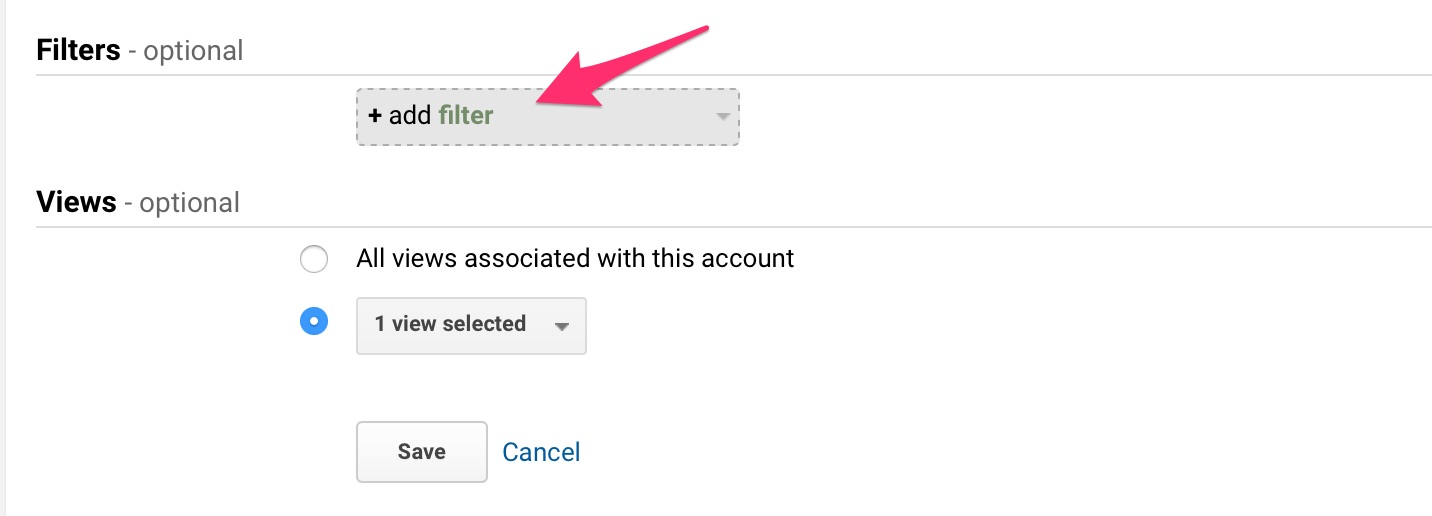
There’s also a feature to add specific filters.
I love this option as it allows you to restrict your data. The more targeted information you have, the more informed decisions you can make.
So add your filters and save your custom report.
There’s a whole database of custom reports created by other people that you can use. You don’t have to start from scratch.
You can access them from the Solutions Gallery.
4. Create custom alerts
Imagine this scenario.
You write an epic blog post.
It gets on the radar of a major influencer and goes viral.
You get a huge traffic spike.
The problem?
Your epic blog post has no content upgrades or any other means of collecting new subscribers.
Buzz dies down before you even get a chance to do something about it.
It’s unfortunate, yes. But it happens all the time.
The simple solution is to create custom alerts for unusual activity on your website. This way, you are notified immediately.
You can capitalize on the positive changes and stop the bad ones from turning into a catastrophe.
That’s why this is one of my favorite features.
I recommend creating multiple alerts for:
- Traffic spikes or drops
- Traffic plateaus
- Drops or spikes in goal completions
- Revenue decreases
- High bounce rates
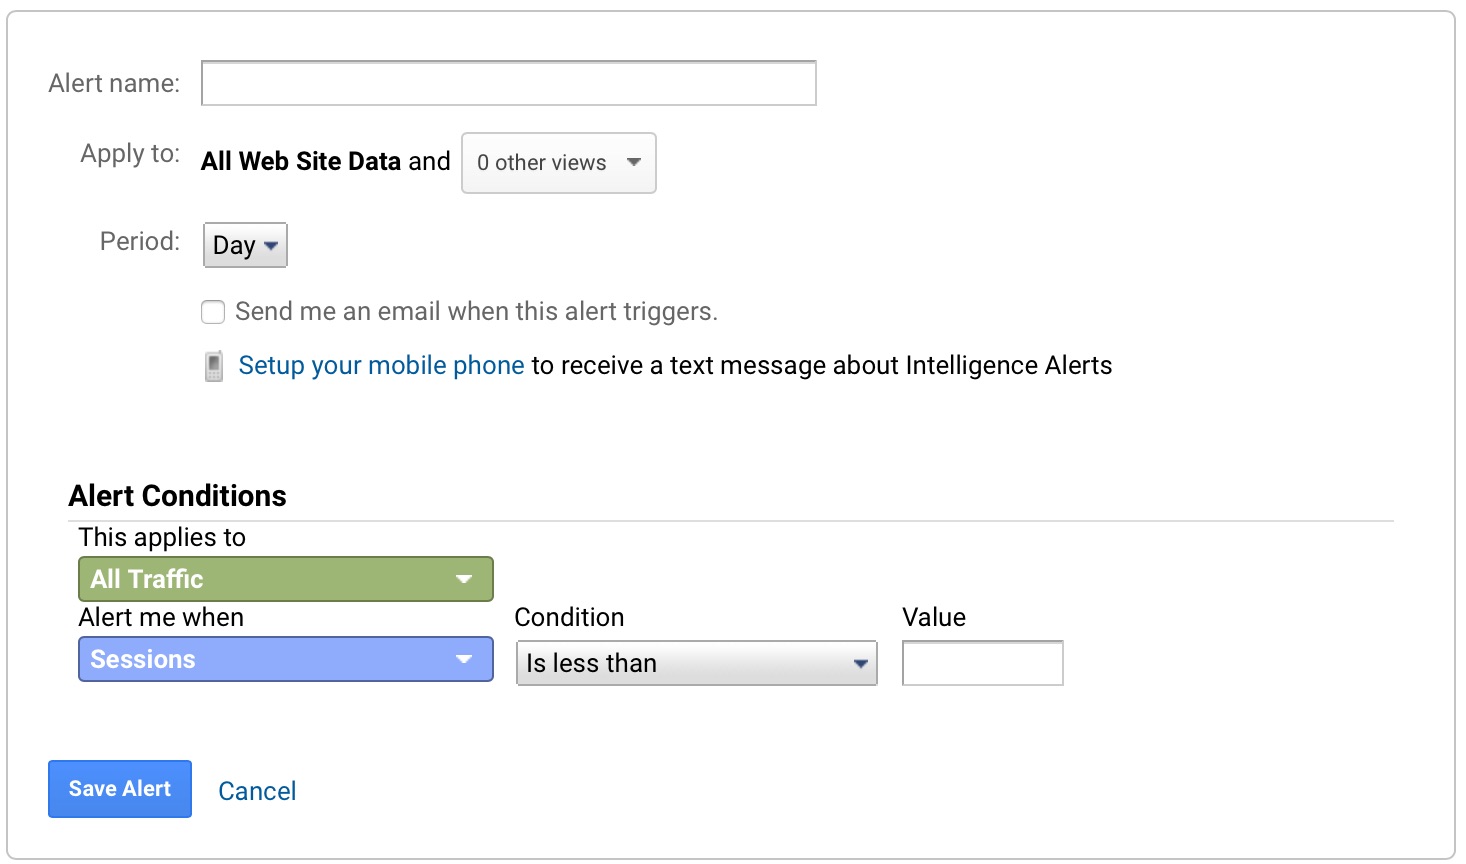
Here’s how to set it up.
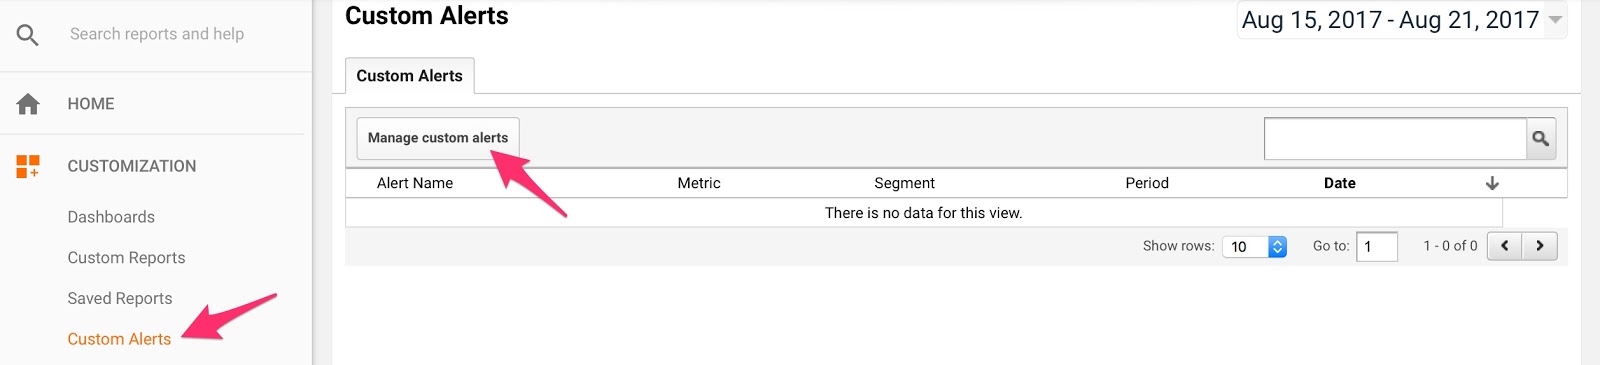
Go to “custom alerts” and click “manage.”
Select “+New alert.”
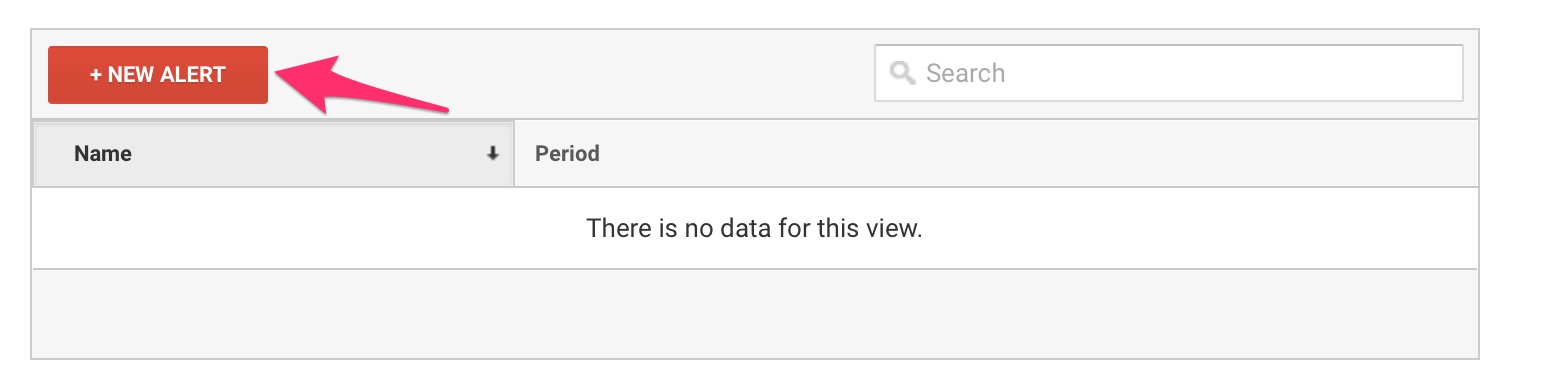
Configure the details and you’re good to go!
Conclusion
Making data-driven decisions for your business is no longer an option.
At least, not if you want to outcompete and outperform other players in your space.
With a tool like Google Analytics, you can track just about anything that happens on your website.
Best of all, this a free tool that puts loads of data in your hands.
You can stick to the basics, but you can also used some advanced tricks to give yourself that edge.
The other thing is that all this data can get overwhelming.
It can also water down your insights.
That’s why I recommend getting as narrow and as precise as possible. Use the advanced segments, customize your reports, and delve as deep as you can.
That’s where the gems are.
Last bit of advice?
Take action.
Use the insights that you gain to double down on what’s working, change what’s failing, and strengthen your business all round.
What Google Analytics features do you use the most?
The post How to Navigate Google Analytics Like a Pro (Way Beyond the Basics) appeared first on Neil Patel.


Comments
Post a Comment